
Posted on 21st Jun 2020 by the LSS team
#market structure
 We want to offer our premium members access to quantitative research that adds value in their investment process. Without overcomplicating it or burdening you with mathematics, we want to offer you a glimpse into quantitative methodologies and tools that can complement your existing investment process. One of the things you can expect from us on ongoing basis are visualizations of market structure through complex network diagrams. Here we show you the first one for June 2020.... Read More
Posted on 28th Jun 2020 by the LSS team
#market structure
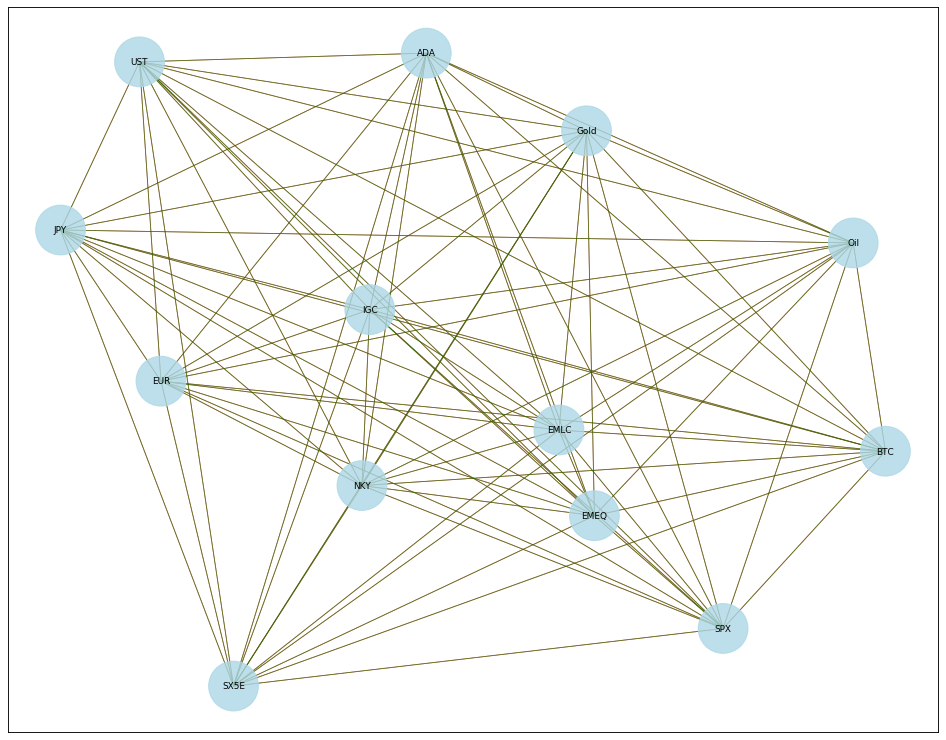
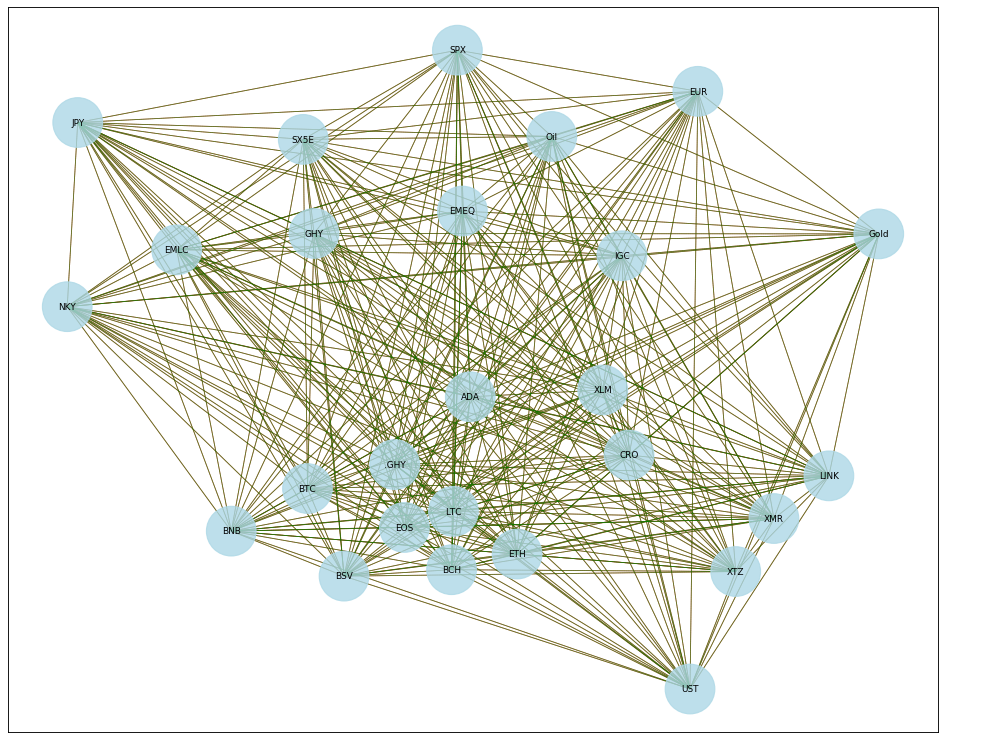
 On an ongoing basis, LSS Quant Research takes a deeper look at market structure using a set of charts ("complex network diagrams") that are used to visualize correlations in a way that goes beyond basic correlation matrices. This way of studying the market allows for enhanced understanding of market structure and dynamics, in order to see which assets as a group cluster together, as well as how markets behave during periods of calm or stress.... Read More
Posted on 4th Jul 2020 by the LSS team
#market structure
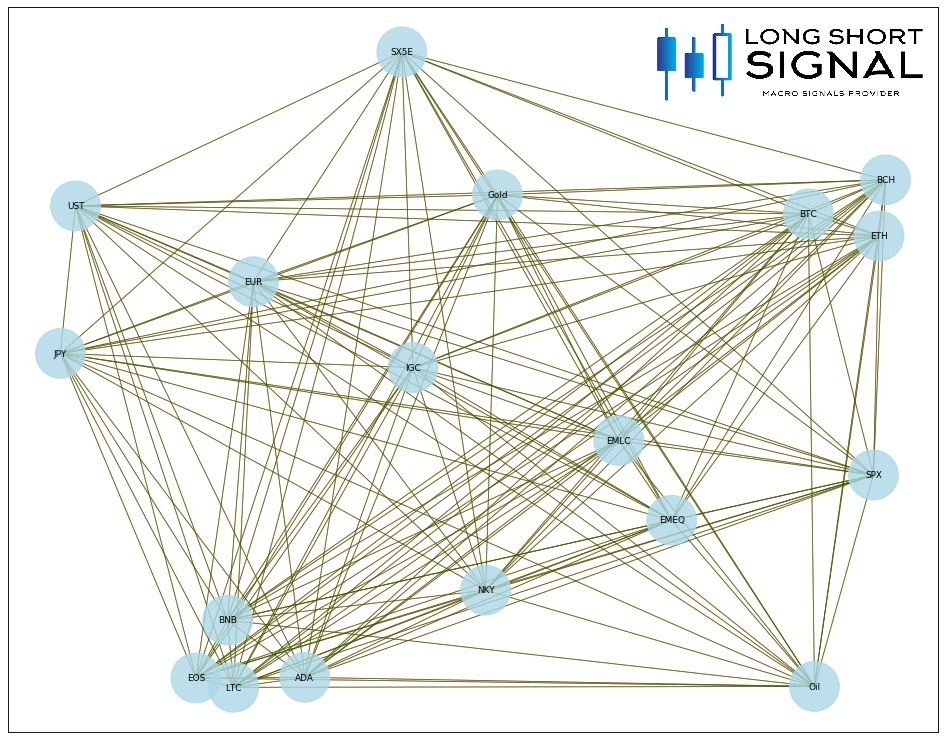
 What's up LSS Premium members, I thought to do a quick update on market structure over the last 30 days. Markets have been further calming down from the high volatility experienced earlier in the year and order seems to have been somewhat restored. Predictable patterns are taking shape again and looking at the network chart for the last 10 days a few things stand out to me. In short summary, order is restored and we see traditional risk/safe haven buckets, as well as crypto still divided between 2-3 buckets.... Read More
Posted on 11th Jul 2020 by the LSS team
#market structure
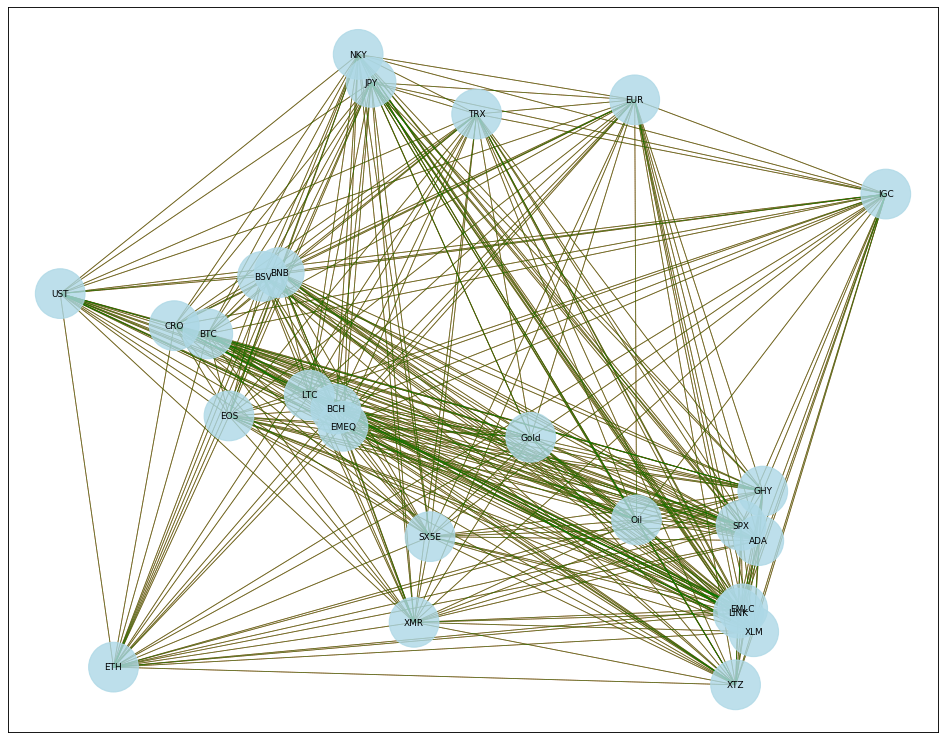
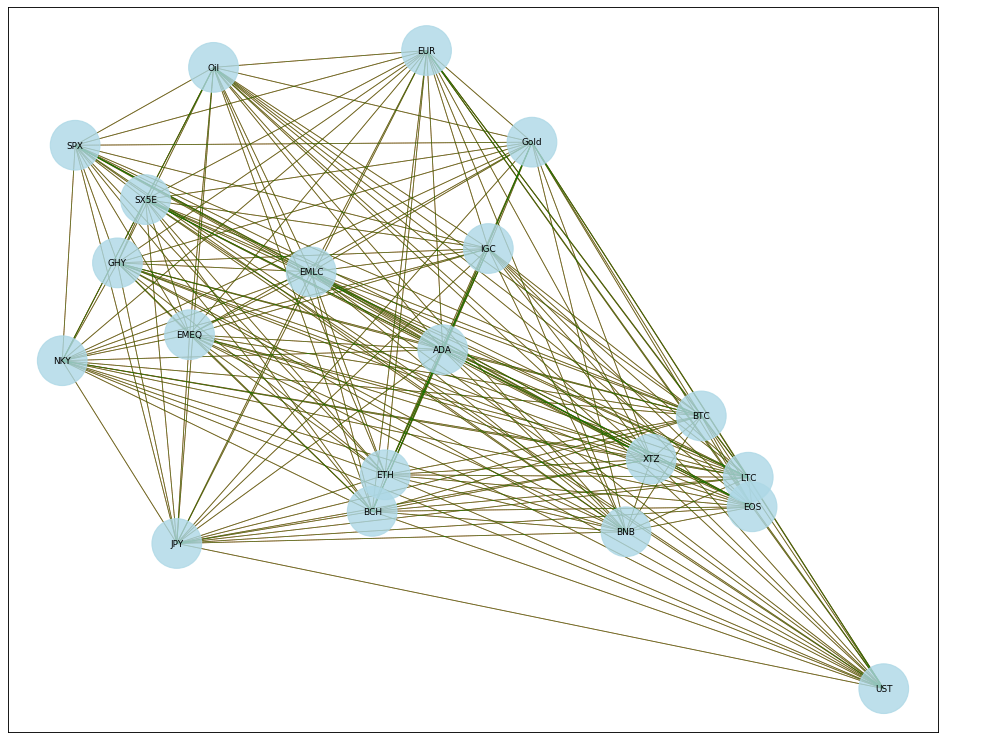 What's up all. Another very quick update on market structure for your investment insight. This week again we have a number of cryptos clustering together (BTC, LTC, EOS, XTZ and BNB) while others form a different pack altogether (ADA, ETH, BCH). We have US treasuries playing their safe haven role and increasingly standing out from the market again, while emerging markets remain at the heart of what I'd like to call the broader "risk cluster". Major European, US and Japanese stock indices cluster together and global high yield debt has been sticking closely to them. Happy trading!... Read More
Posted on 18th Jul 2020 by the LSS team
#market structure
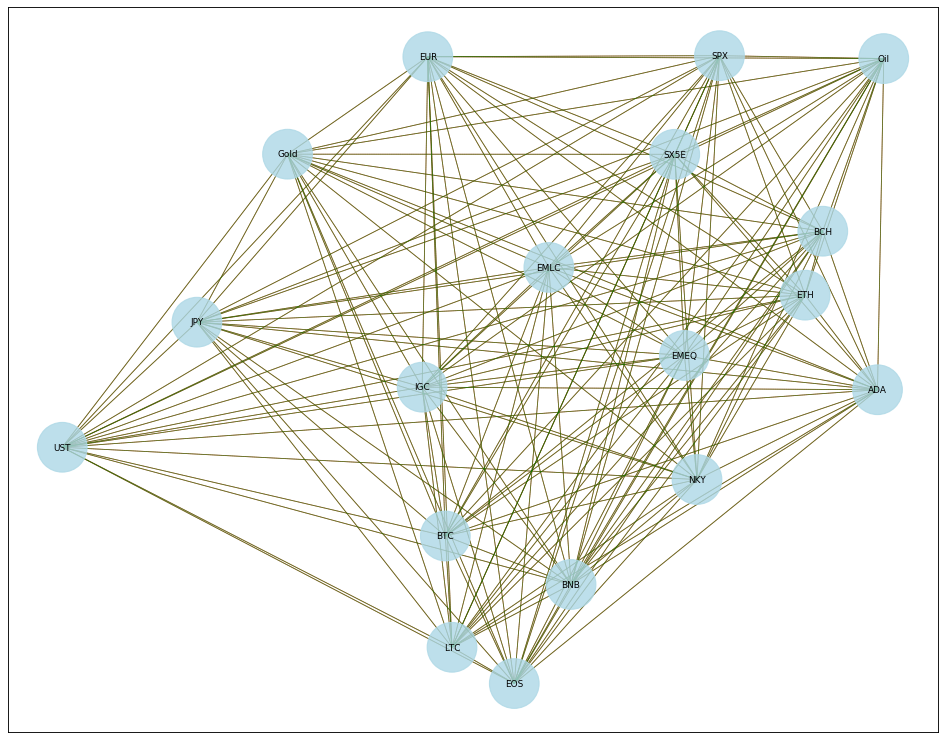
 What's up LSS Premium members, hope you are all enjoying your weekend. Wanted to share with you all a quick update on market structure as you have by now hopefully become accustomed to. We run these visualizations of market structure using network charts (based on Kamada-Kawaii least cost-path functions) on a weekly basis, as they help to better understand which assets correlate, cluster together and are furthest removed from each other.... Read More
Posted on 24th Jul 2020 by the LSS team
#market structure #Cryptocurrencies #correlation #market views #weekend thoughts
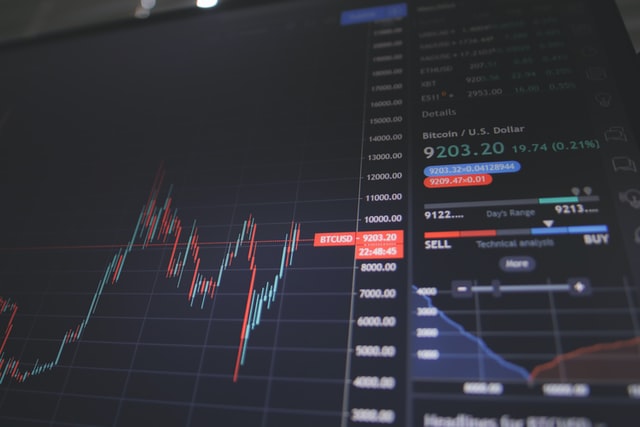 I make it a habit to study both the micro structure and the macro structure of the market. What I mean by that is that I may spend a lot of time looking through correlation matrices, studying market structure and broader patterns over longer term data, but despite not really being much of a day trader I also find myself glued to Bloomberg screens daily to watch the minute and second ticks of a large number of asset classes. The reason I do that is that I believe often the micro charts provide information about market changes that are going to go on to become longer term trends.... Read More
Posted on 1st Aug 2020 by the LSS team
#market structure
 What's up LSS Premium members. As you will no doubt by now have become used to, once every few weeks we like to update you on something we call "market structure". Here we take a closer look at how markets behave and which assets correlate. But rather than doing that by staring at correlation tables - which are great for spotting correlations between asset A and B but not so much for understanding how the market as a whole works - we use something called network charts for this. As in previous weeks, this week our main focus remains on crypto markets which apear to be breaking up.... Read More
Posted on 2nd Aug 2020 by the LSS team
#Bitcoin #statistics #market structure
Whenever Bitcoin does relatively well for a few weekends in a row, the discussion starts again about whether there is some sort of "weekend effect" present in Bitcoin returns that we should all be aware of. I should know, as I am writing this to you on a Saturday where Bitcoin is going up 5%. We did a little bit of digging of our own based on the latest data available to better understand to what extent this is or isn't true. ... Read More